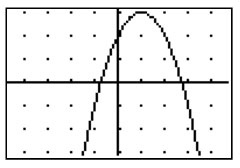
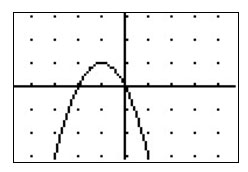
Which of the tables shown below contains ordered pairs from the graph of the parabola?
| A. | 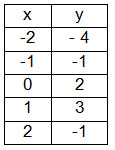 |
C. | 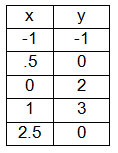 |
| B. | 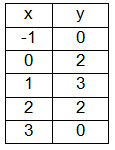 |
D. | 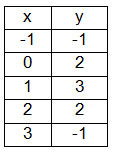 |
A
Incorrect. Only some of these points lie on the graph.
B
Incorrect. Only some of these points lie on the graph.
C
Incorrect. Only some of these points lie on the graph.
D
Correct! All of these points lie on the graph of the parabola.
Which of the equations shown below best represents the graph of the parabola?
A
Incorrect. The graph of this equation would open upward. Which part of the equation reveals whether the graph opens up or down?
B
Correct! This equation has zeros (x-intercepts) at x = -2 and 0.
C
Incorrect. This equation has zeros at x = 0 and 2, but the graph has x-intercepts at x = -2 and 0.
D
Incorrect. This equation has a double root at x = -2, but the graph has x-intercepts at x = -2 and 0.
Which of the equations shown below best represents the graph?
A
Incorrect. The graph of this equation has zeros at x = -3 and 1.
B
Incorrect. The graph of this equation opens downward.
C
Correct! The graph of this equation opens upward and has zeros at x = -1 and 3.
D
Incorrect. The graph of this equation opens downward.
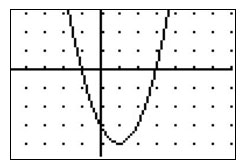
Which of the following statements best describes the quadratic function whose graph is shown?

A. The function has a minimum and two real zeros.
Correct! The graph has two x-intercepts so it has two real zeros.
B. The function has a minimum and two imaginary zeros.
Incorrect. If the zeros were imaginary, then the parabola would not have any x-intercepts.
C. The function has a maximum and two real zeros.
Incorrect. Since the parabola opens upward, it has a lowest point which is called a minimum.
D. The function has a maximum and two imaginary zeros.
Incorrect. Since the parabola opens upward, it has a lowest point which is called a minimum. If the zeros were imaginary, then the parabola would not have any x-intercepts.
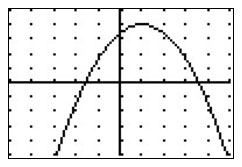
Which of the following statements best describes the quadratic function whose graph is shown?
A. The graph increases to a maximum of 3, then decreases.
Incorrect. This answer is partially correct. The parabola increases to a maximum of 4.
B. The axis of symmetry for this parabola is the x-axis.
Incorrect. The axis of symmetry for a parabola must be vertical.
C. The zeros of the function are x = -1.5 and 4.3.
Incorrect. While it “looks like” the parabola has x-intercepts at x = -1.5 and 3.3, you cannot tell “for sure” without the equation.
D. The parabola has an axis of symmetry at x = 1.
Correct! The axis of symmetry for this parabola is the vertical line x = 1.
The graph shown below shows a ball’s height in meters above the ground t seconds after it was thrown upward from a tower that is 35 meters tall.
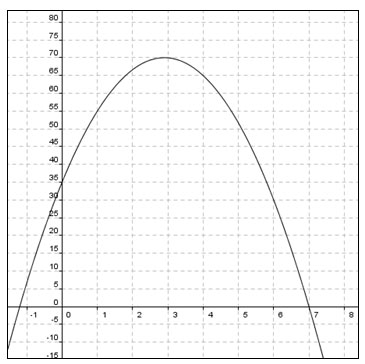
A. The ball was in the air for about 8 seconds.
Incorrect. The ball was thrown at time t = 0. Go back and check the graph again.
B. The ball reached its maximum height about three seconds after it was thrown upwards.
Correct! The vertex of the parabola is at (3, 70).
C. The ball was more than 55 meters above the ground for about 5 seconds.
Incorrect. Count the number of units between the two points where the ball had a height of 55 meters.
D. The ball landed about 7 meters away from the tower.
Incorrect. The graph is not a picture of the path of the ball. It is the height of the ball at a certain time after it was thrown.